 Earlier this year we reported that Google had processed the five billionth DMCA takedown request for its search engine, a massive number.
Google search has reported these numbers for nearly a decade. However, the volume of copyright claims sent to its sister site YouTube has remained a mystery. Until now.
Yesterday, YouTube released its first-ever copyright transparency report which provides an in-depth overview of how many ‘infringements’ are reported on the platform. The first release covers the first half of 2021 and shows that the volume of reported infringements well exceeds that of the search engine.
Webform, Copyright Match, and Content ID
Before diving into the numbers it’s good to clarify that YouTube has three main copyright reporting tools. The most basic one is a DMCA webform through which anyone can report an infringement. The second option is the Copyright Match tool, which is open to roughly two million channel operators whose content is regularly reposted.
The third and perhaps best-known option is the Content ID program. This service is the most advanced and works with reference files that rightsholders can upload. It’s also the tool that’s most limited in availability, as fewer than 10,000 rightsholders are approved to use it.
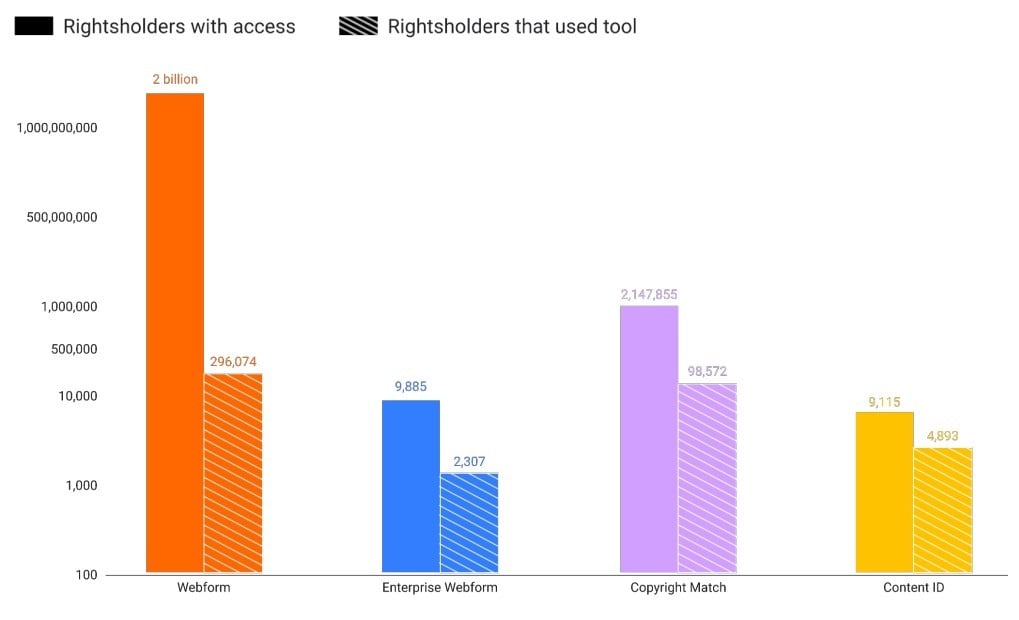
While only a limited number of copyright holders can use Content ID, its mostly automated nature results in the most claims by far.
722,649,569 Content ID claims
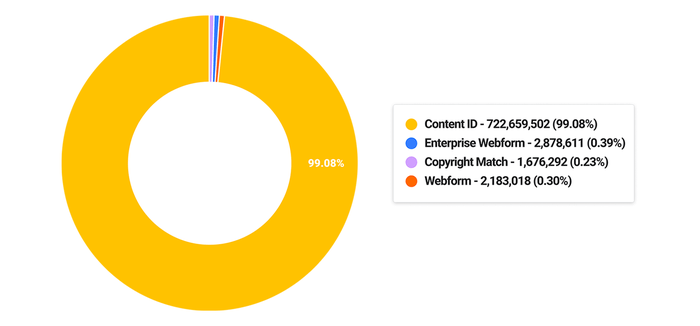
During the first half of this year, 722,649,569 Content ID claims were made. This is an average of four million per day or 46 per second. Most of this activity is automated without any human involvement.
The chart below puts the different claims in context. Compared to Content ID, the number of Webform (2.2M), Enterprise Webform (2.9M), and Copyright Match (1.7M) claims seem rather minuscule but these are all well over a million too.
Mistakes and Abuse
One of the reasons why YouTube limited the use of Content ID to a small group of rightsholders is the potential damage that can be done. An inaccurate or abusive reference file can result in thousands of automated claims.
This potential for abuse isn’t purely theoretical. Just last week, the U.S. Department of Justice indicted two men who allegedly “stole” millions in advertising revenue by making false copyright claims through YouTube by falsely representing rightsholders.
Regular mistakes happen as well, and that’s why YouTube has a team that reviews the accuracy of reference files. These can be flagged if they include content for which rightsholders don’t exclusively own the rights, or if public domain content is included, for example.
YouTube’s transparency report suggests that relatively speaking, Content ID indeed leads to fewer mistakes and less abuse. Of all requests, less than one percent is invalid or abusive, while 99.3% of all claims result in removals.
If we look at the traditional Webform, only 83.8% of the claims result in content being removed, while 8.6% are classified as abusive and 6.5% as invalid. The Copyright Match tool ranks somewhere between the other two options in terms of accuracy.
Counter Notifications
Of course, YouTube users always have the option to dispute claims, either through the Content ID system or through a counter-notice.
Keeping the differences in accuracy in mind, it’s no surprise that the highest percentage of counter-notices are sent in response to webform complaints. The number is higher for regular Webform takedowns (5.2%) than Enterprise Webforms (1.9%), which are used by trusted partners. For the Copyright Match tool, only 1.3% of the claims are disputed.
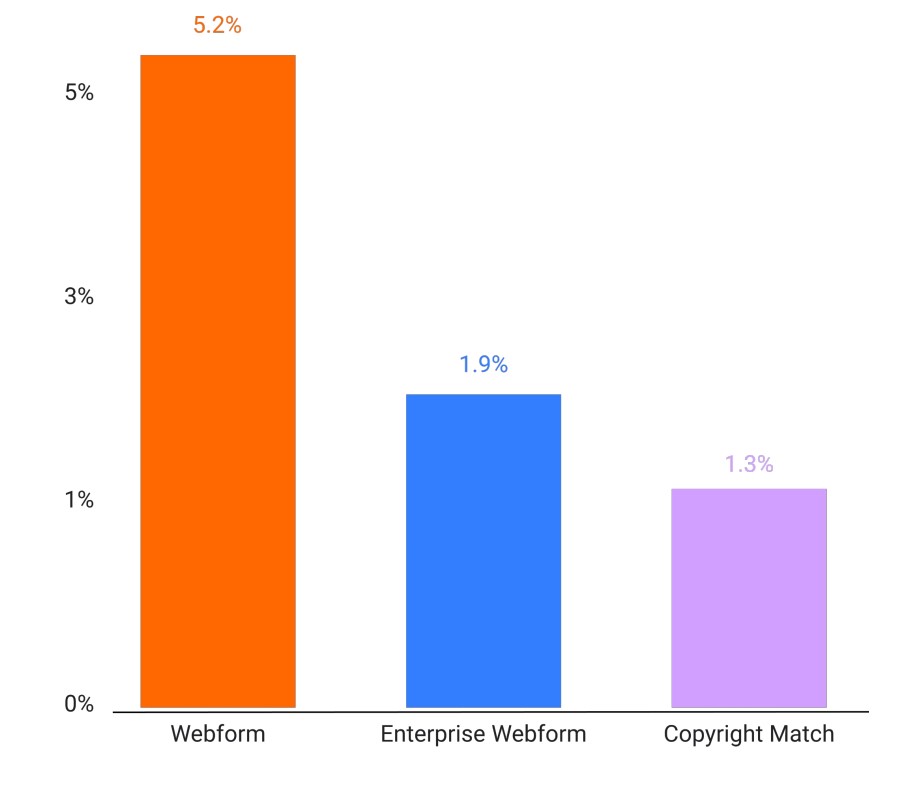
For the Content ID system, the dispute percentage is even lower at 0.5%. However, in absolute numbers, this translates to 3.7 million disputes, which is still a significant number.
Disputes Can Pay Off
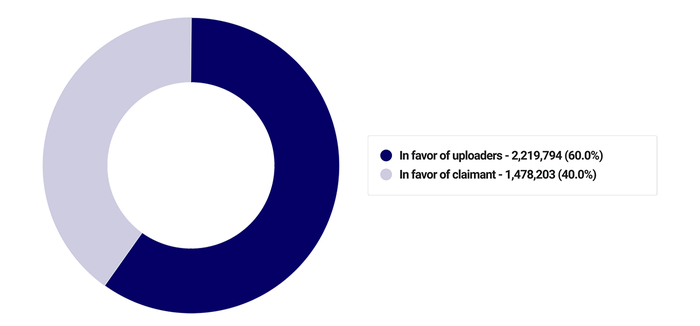
According to YouTube’s numbers, it can certainly pay off to dispute a claim. As shown below, the majority of all Content ID disputes (60%) are resolved in favor of the uploader.
It is worth noting that Content ID claims don’t automatically lead to content removals. Many rightsholders prefer to keep content up in exchange for the advertising revenues the video generates.
Content ID claims can also be escalated in regular DMCA takedown claims, after which they enter a separate process. If a claim is disputed there, YouTube is required by law to restore the content, unless the rightsholder files a lawsuit. This happens in fewer than 1% of all counter-notice cases.
Questions
The full report adds more context and details to the numbers covered here and is well worth a read. However, it also raises some questions.
For example, there are no details on what percentage of all Content ID claims result in takedowns vs. monetization. In addition, the report doesn’t show how many counter-notices Google itself chooses to reject.
We requested further transparency from YouTube on these points and also asked if Enterprise Webform notices are treated differently than those sent through the regular Webform. However, a spokesperson said that they are not able to comment on these issues.